At TritonWear, we strive to go beyond just tracking data. We are dedicated to enhancing the user experience by automating data analysis and providing the actionable insights you need to create faster swimmers. Our goal is to help swim teams, coaches, and athletes better understand their data.
In this article, you will learn how to use Triton Score and Focus to assess your swimmers' training performance by providing a clear image of the quality of your swimmers' skills. You'll know exactly how they're swimming from wall to wall. Let's dig in!

How Well Did your Swimmers Train?
Triton Score
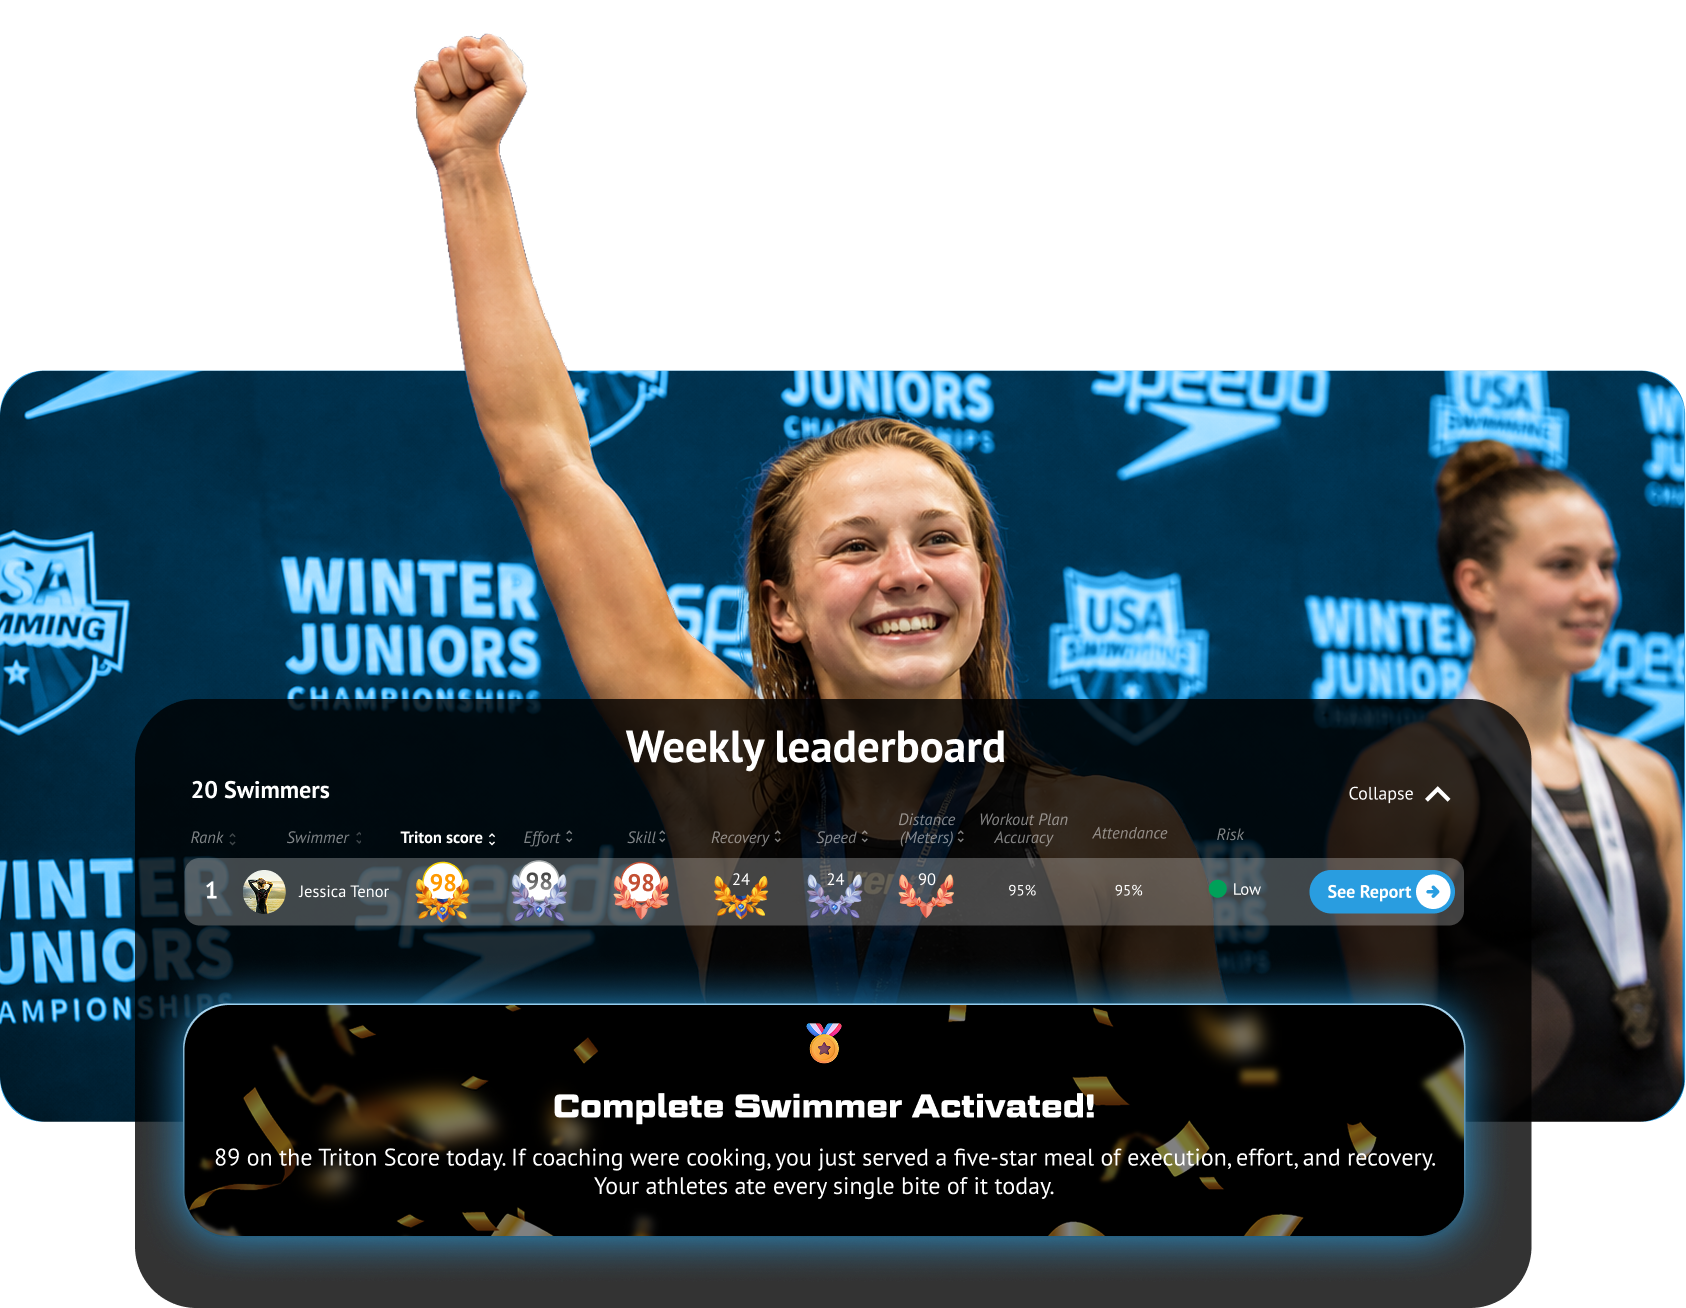
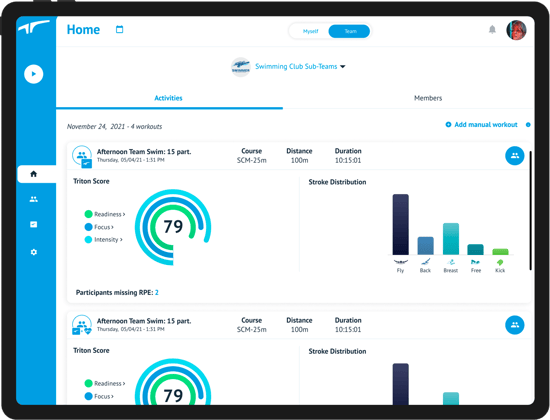
The Activity feed on the app shows the average Triton Score for all your swimmers for that specific practice or workout. This average score shows how well your group trained overall, the goal is to hit a score above 75 on every workout. A higher score means a better training session. This is done by ranking training performance in the 3 critical pillars for improvement in every workout: Readiness, Focus, and Intensity.
Readiness
The Readiness score helps keep your athletes' bodies race ready. It calculates how much the volume and the intensity of training changed and shows your athletes' training status and injury risk to assess their readiness to perform.
The Readiness score ranges from 0-100.
90 or higher: Optimal. Keep it up!
80-90: Well enough. Look at app recommendations for insights.
Under 80: Pay attention; status will alert you if you’re over or undertraining.
If the score hits 90 or higher, you're increasing training at an optimal rate. The goal is to keep the Readiness Score between 90-100, where you are maximizing improvement while keeping athletes primed to perform.
Learn more about TritonWear Readiness
Focus
The Focus score summarizes how well your swimmers executed their technical skills compared to a benchmark of their own past performances. Skill execution is not just important during test sets; true behavioural change in the water happens when swimmers focus on their skills every practice, every set, and every wall.
With Focus, you'll know if your athletes' skills are improving over the season and learn where you need to focus your attention to help improve your swimmers most.
The Focus Score ranges from 0-100.
100+: Amazing. Well done!
75-100: Improving. Keep it Up!
Under 75: Look at insights for ways to improve.
If your athletes' scores are hitting 75 or higher, they improve their technique optimally. When compared to others, a score above 75 means their skill execution is better than others of similar gender, height and speed.
Learn more about TritonWear Focus
Intensity
The Intensity score is calculated by using metrics like distance, active time vs rest time and swim intensity (swim speed). TritonWear uses AI to set an average of the athletes' usual distance, active time and swim intensity and adjusts this average as they improve or train harder.
The Intensity score ranges from 0-100.
85 or higher: Wow! There was a spike in intensity today; check out Focus and Readiness scores to ensure it did not impact skill execution or injury risk.
75-85: Congrats, that was the definition of a solid swim; keep it up! Discover which skills to Focus on for even faster swimming.
Under 75: There was a drop in Intensity. Head over to Readiness to make sure the athletes are not under training.
If the score hits 75 or higher, you are either spending more time training in anaerobic zones or have increased overall distance or active time (work vs rest). Swimmers, we'll receive personalized recommendations indicating exactly what caused a spike in Intensity. Keep in mind that while intense training promotes fitness gains, it’s crucial to maintain a balance between intense workouts and recovery.
When interpreting the Intensity score, it is also best to review the Readiness and Focus Scores. Consistently high-intensity training may put athletes at a higher risk for injury and may also affect their ability to hold technique.
Learn more about TritonWear Intesity
Which Swimmer Needs your Help the Most?
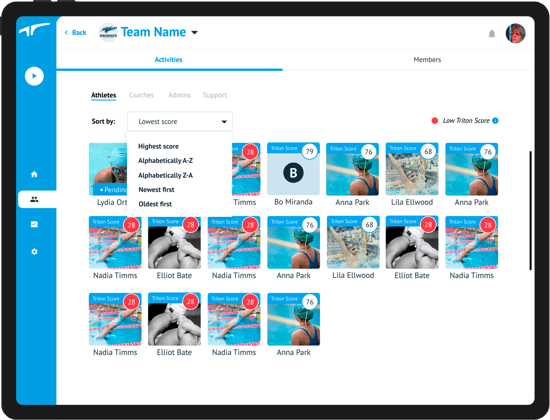
The Members' view on the app shows you each swimmer's tile and their individual Triton score. Use this to:
- Identify the swimmer(s) with the lowest score.
- Assess why ( were they sick, returning from an injury, or do they regularly sacrifice technique for intensity- check Readiness and Intensity).
- Look at the scope of the practice and how it impacted performance.
- Then dig into their Focus scores.
Are Your Swimmers' Skills Improving?
For this example, we used a swimmer whose Triton Score and Focus were the lowest. So, what does the score say about this swimmer’s skill execution for this practice?
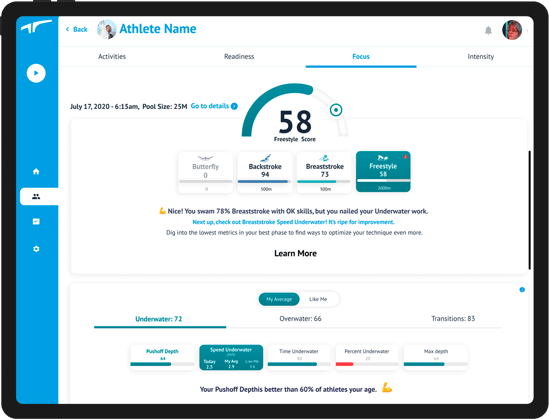
58 is the swimmer's average Focus score, an average taken from the stroke scores, as shown under the circle plot. This is not a straight average but rather a weighted average because most practices will be spent doing more freestyle than other strokes.
In this given workout, the swimmer knocked it out of the park in Backstroke with a 94 score, a great indication this swimmer's Backstroke skills are improving. However, Breaststroke (73) and Freestyle (58) still require a lot of focus and attention to skilfully master them.
How do their skills compare to the competition?
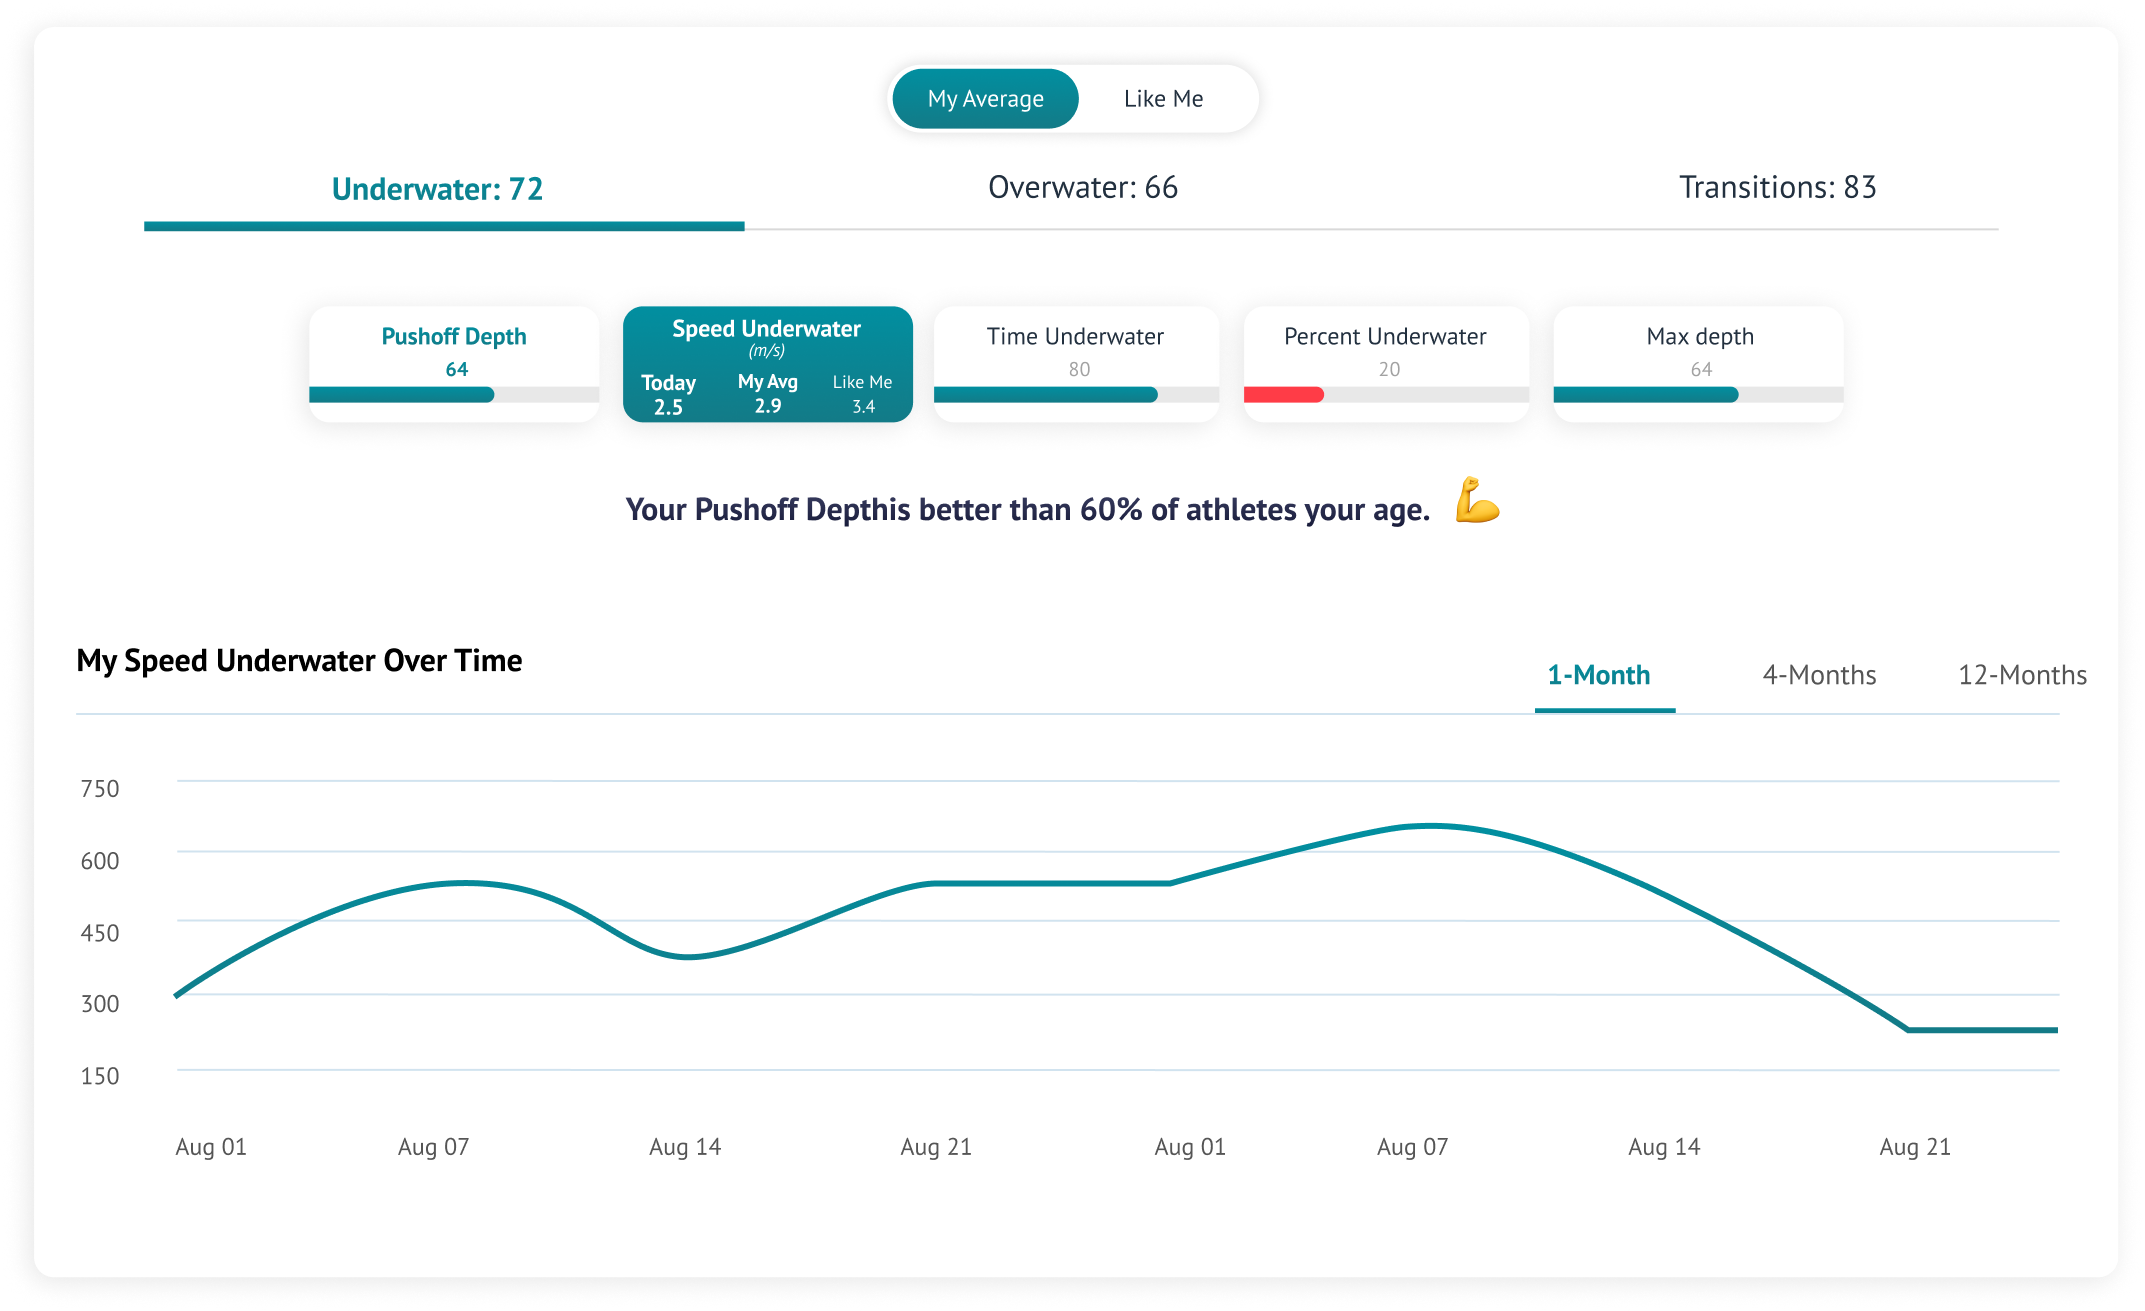
To know how your swimmers' skills compare against their own average or other swimmers, you can toggle between the ''My Average'' and ''Like Me'' scores for each metric on the Focus dashboard.
Every metric correlates to a part of your athlete's swimming technique. The ''My Average'' comparison shows how they improve their technique daily. The ''Like Me'' comparison shows how their skills measure against the competition. It considers swimmers of similar speed, height and gender.
Here the app shows the different swim phases each stroke type is broken into underwater, overwater and transitions. This shows what part of your athlete's swimming you need to focus on immediately to help them make the biggest gains.
In this analysis, the swimmer needs to work on the underwaters for freestyle to match the competition, specifically his Underwater Time and Percent Underwater. The takeaway is to work on maintaining his Underwater Speed while increasing Time and Percent Underwater.
As a coach, you can use real-time data during workouts to find the optimal break-out for this swimmer. You can do this by testing out a different number of underwater dolphin kicks (2,4,6) and looking at the tradeoff between Speed Underwater and Time Underwater or Speed Underwater and Speed Overwater. You can do this by choosing any combination of input and output metrics for any stroke, swimming phase or metric.
If you see yourself as a coach with a growth mindset or someone ready to take coaching to the next level, grab this playbook; it's step-by-step guidance to help you integrate data into your seasonal plan.