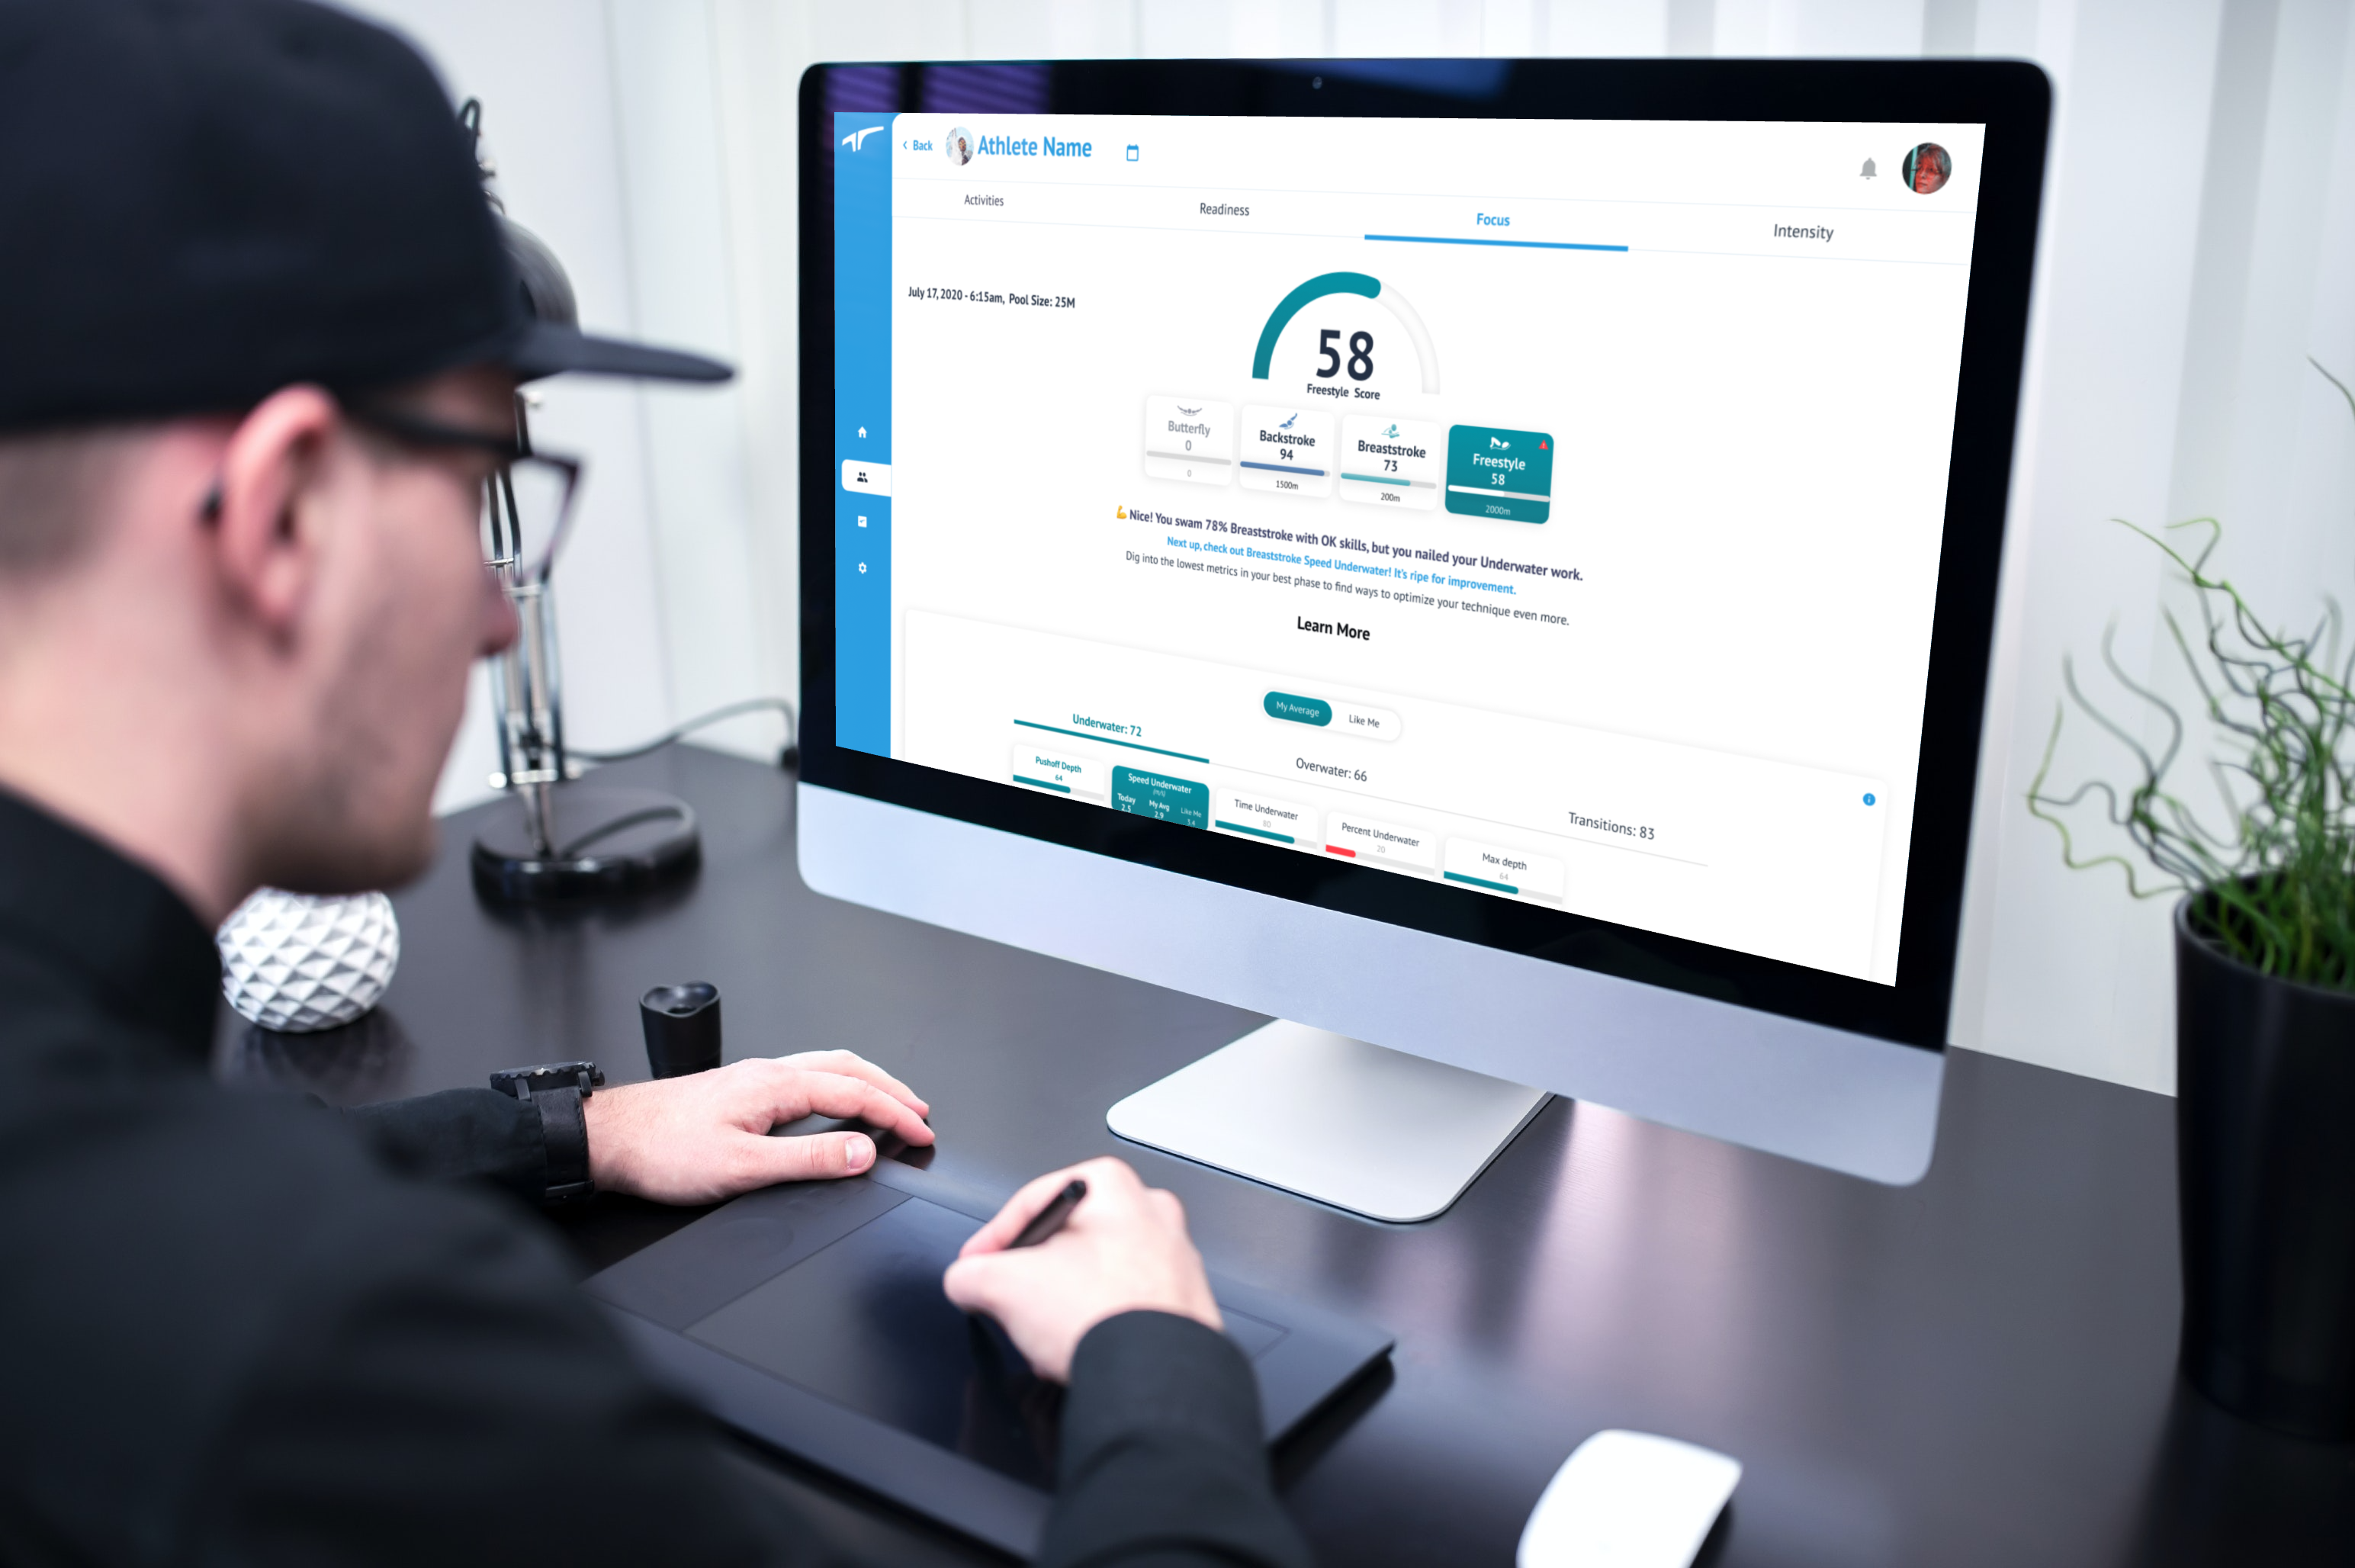
TritonWear Focus answers the question, ‘’how well did my swimmers execute their skills, and what skills should I focus on first to help them swim faster?’’ Skill execution is a balancing act that fluctuates every practice, often prioritizing to improve technique in one area before correcting another. The Focus score summarizes how well your athletes executed their technical skills compared to a benchmark of their own past performances.
How TritonWear measures Focus?
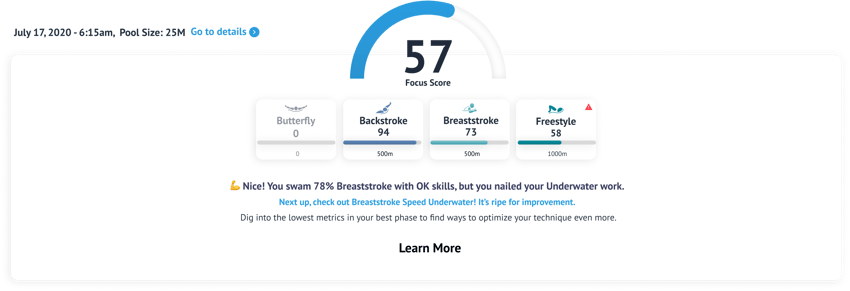
TritonWear measures technical execution in each stroke relative to how much distance was spent performing that stroke. Each Stroke score is an average taken from your athletes' Phase scores (overwater, underwater, transitions).
The app needs a minimum of 5 workouts to build your swimmers' profile for each stroke type. This is because several data are required for the algorithm to create their freestyle, backstroke, breaststroke and butterfly models.
It is not uncommon for practices to rely heavily on freestyle. However, each stroke impacts the Focus Score the same way, regardless of whether 80% of the workout was completed doing freestyle and 20% butterfly. Strokes are weighted individually so that the values don't appear higher for freestyle but less for the other strokes.
How do you interpret Focus Score?
The Focus Score ranges from 0-100.
100+: Amazing. Well done!
75-100: Improving. Keep it Up!
Under 75: Look at insights for ways to improve.
If your athletes' score is hitting 75 or higher, they’re improving their technical skills at an optimal rate. When compared to others, a score above 75 means their skill execution is better than other athletes of similar height and speed. Remember that 'elite swimmers' have the best combination of metrics; they are not necessarily the highest scorers in individual metrics.
The Three Phases of Swimming
TritonWear Focus has over 30 metrics divided into 3 phases: the transition phase, the underwater phase and the overwater phase. Similar to strokes, each phase is weighted differently because the amount of time spent in each phase varies greatly. Transitions, for example, only amount to about 5-10% of the workout. While overwater and underwater are weighted depending on how much time the athletes spent OW versus UW during each workout. It's quite common for 20% of the workout to be UW for short-course while for long-course, it's usually even lower.
Transitions. Turns and push-offs are part of the transitions. In the Focus Score, you’re able to track performance using these Focus metrics: Transition Time, Turn Time, Push Time, Puch Max Acceleration and Push Strength.
Underwater. After the transition phase, we move into the underwater portion of the swim. In the underwater phase, you’re able to track performance using several different Focus metrics like Push Depth, Time Underwater, Speed Underwater, Percent Underwater, and Max Depth Underwater.
Overwater. Last is the overwater phase. In this phase, you can track performance using the following Focus metrics: Stroke Rate, Distance Per Stroke, Stroke Index, Swolf, Overwater Time, and Overwater Speed.
Understanding Focus Comparisons
Focus comparisons measure your swimmers' most recent activity against their past practices (my average) or against other athletes like them (like me).
For the ‘’Like Me’’ comparison, the algorithm considers swimmers of similar speed and height. It's important to note that there is no single person the app uses to compare your athletes with; several users create the model (based on height and speed).
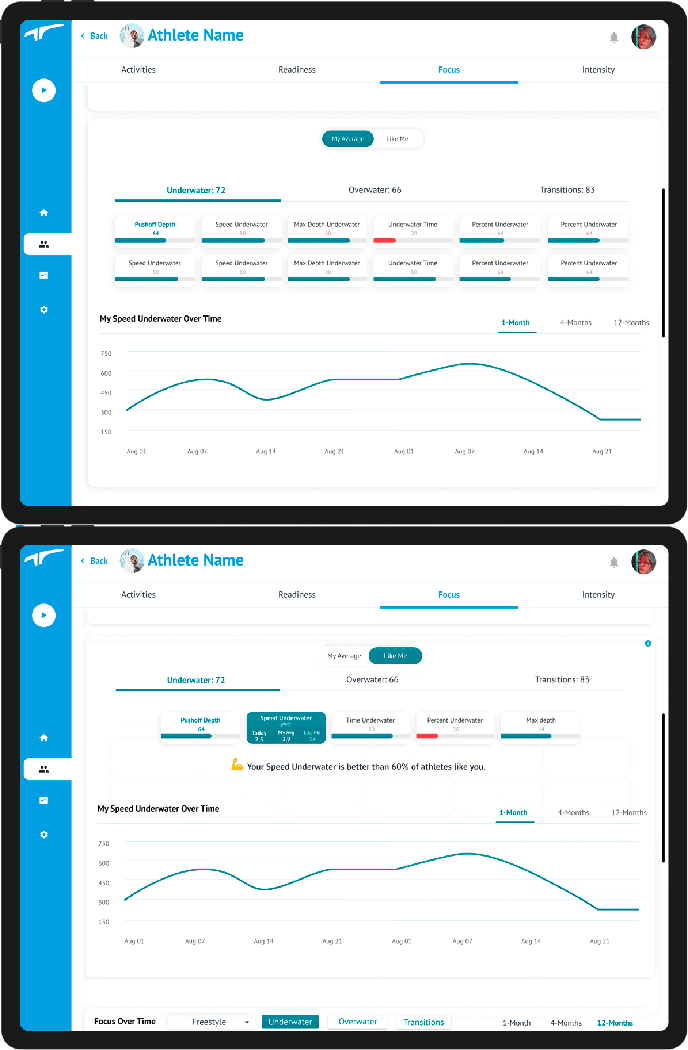
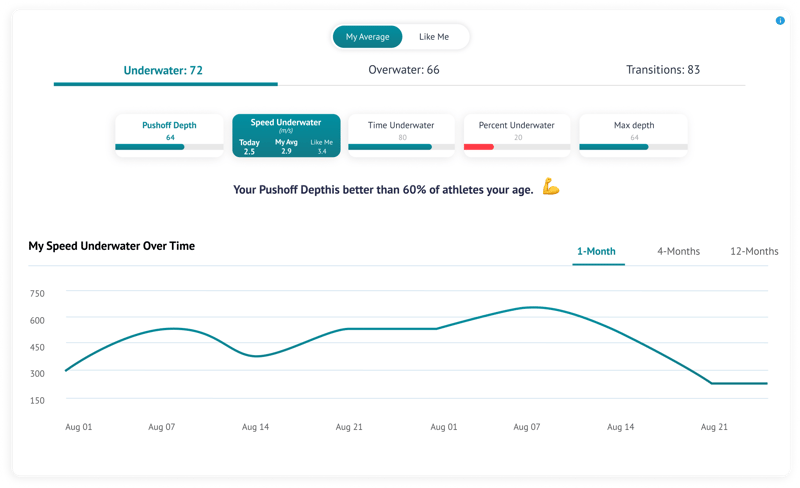
The Focus progress graph offers great insights into how your swimmers' technique is changing (are they improving or staying the same). In the example below, we're looking at a comparison of a swimmer's average (My Average) for the underwater phase with Speed Underwater as the selected metric. The Speed Underwater card shows his/her skill today, average and like me.
Make the most of the Focus Progress Graph by aiming to improve your technical skills month over month and get a good sense of how your current tracked behaviour in the water affects your swimming speed.

Next, learn more: Breaking Down High and Low Focus Score.
If you see yourself as a coach with a growth mindset or someone ready to take coaching to the next level, grab this playbook; it's step-by-step guidance to help you integrate data into your training.



.png)
