Overview of Team Performance
Recovery

Attendance
Tracking attendance is essential to understanding the commitment, engagement and participation of your swimmers. Consistent attendance and regular use of their Triton units usually coincide with better performance. Swimmers who show up for and track all workouts are more inclined to stick to the training plan, leading to steady improvements. By keeping an eye on attendance you can identify patterns such as which swimmers are frequently missing workouts allowing you to address any potential issue early on.
In the app, each circle symbolizes a workout, colour-coded to represent the pool type, and the number inside indicates the number of swimmers actively tracking that session. This visual representation allows you to quickly assess participation levels and see which sessions had higher or lower attendance.

Athlete Status
Athlete status shows if your swimmers are overtraining, undertraining, or training safely, and it also indicates their risk level for injury or illness. How do we do it? We use the acute-to-chronic workload ratio.
This ratio helps you determine whether your swimmers are doing too much too fast, resulting in a higher change in load (above 130% ), or not enough (below 80%), resulting in a lower change in load. Maintaining a balanced workload is essential for preventing injuries and ensuring consistent performance improvement.
In the app, the Athlete Status is displayed using a pie chart. The chart helps you easily identify how many swimmers are overtraining (red), undertraining (orange), and training safely (green) among your athletes. The unknown portion (gray) indicates swimmers with missing workout ratings.

The risk level for athletes varies based on the ACWR ratio. Athletes with a ratio close to 80-130% are at low risk, while those further away from this range face moderate to high risk of illness or injury. These insights help you adjust training plans effectively, ensuring your team progresses and minimizes potential risks. Use these insights to keep track of your athletes' workload and help them stay healthy and strong.

Training Balance
Training balance helps you understand if your team maintains an effective and balanced training regimen. You can check this balance by looking at 3 key metrics:
- Intensity vs. Target compares your swimmers' average training intensity to the weekly target. This comparison helps you see how closely they met the desired intensity levels. If there's a significant deviation, you can adjust future workouts to make training more effective.
- Volume vs. Target measures the actual weekly training volume against the planned volume. This ensures your swimmers are getting the right amount of training. Both Intensity and Volume targets are set in the app at the beginning of each workout during your planned intensity. Training balance then shows how close your team is to meeting these targets.
- Skills vs. Expected tracks how well your athletes are improving their skills compared to the benchmark of 75. This helps in seeing if they did well on their skills last week and making plans for the following week accordingly.
In this example, the swimmers slightly underperformed in intensity (77 vs. 79), slightly exceeded the volume target (76), but maintained a good focus on skills. By monitoring and adjusting these factors, you can optimize your athletes' performance and development.
.png?width=1366&height=1024&name=Training%20Balance%20(1).png)
Effort

The pie chart will show how closely the actual training aligned with your planned distribution. By seeing the breakdown of how much recovery, aerobic, threshold and speed work was done, you can gauge training effectiveness and identify areas needing adjustment. This detailed view allows you to make informed decisions to optimize your team's performance and ensure that each energy system is being properly trained.

Individual Session Cards
Below the weekly summary, you'll find the individual session cards for each workout run during the previous week. You can see if swimmers adhered to the intended focus and trained the correct energy systems or if they spent more time in zones they were not supposed to.
In detail, the information you will get with each session card is as follows:
- The number of athletes in that workout
- Deviation from the planned intensity
- Training zone distribution vs what was planned
- Volume and rest compared to the plan
- And the average Triton score for the athletes

Reviewing these insights provides a snapshot of how the workout unfolded: the attendance, adherence to planned intensity, time spent in each training zone, and whether the workout aligned with the intended intensity. This analysis helps identify discrepancies between the planned and actual workout execution, highlighting areas where some tweaking may be needed either in athlete training or in setting more accurate planned intensities.
Skills

Stroke Breakdown
The summary offers a snapshot of what you worked on most last week (compared to the last 90 days). Then, the pie chart next to it breaks down the percentage of volume for butterfly, backstroke, breaststroke, freestyle, and kick. This breakdown helps you assess if you're adequately targeting all four strokes and kick work in your training.
Highest and Lowest Metrics
While analyzing the breakdown of each swimming stroke, pay close attention to the highest- and lowest-scored metrics. The results may be influenced by the training focus of that particular week.
For instance, during a taper week, you may expect the Stroke Rate to be high, whereas in a recovery week, speed metrics like Speed Underwater may be lower. Understanding the context behind these fluctuations can help you make more informed decisions when planning your training sessions to address specific areas of improvement for your team. 
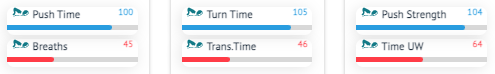
Detailed Skill Metrics Breakdown
The skill drill-down shows your athletes' performance across 20+ different skill metrics. It is separated into three phases: underwater, overwater, and transitions (turns), and it compares your swimmers' performance this week to their typical performance..png?width=1093&height=416&name=Skills%20drilldown%20(1).png)
When you see metrics highlighted in blue (score 75 and above), it indicates that your athletes improved compared to their averages this last week. This allows you to celebrate progress and reinforce positive behaviours.
On the other hand, when you notice metrics highlighted in red (score below 75), it signals areas where athletes may need to focus their efforts to enhance performance. By identifying these areas, you can tailor training to address specific skill deficiencies and help swimmers reach their full potential.
Don’t forget to pay attention to the percentages below each score associated with each metric, as they indicate the degree of improvement or regression.
Athlete Details Card

Training Zone Summary
At the top of the card, you'll find how much time each athlete spent in zones one through five. This visual allows you to swiftly evaluate the balance of their training efforts across various intensities and observe how differently athletes execute the same workouts. Coaches find value in using this tool to identify swimmers who may be spending excessive time in pink and red zones, or pushing themselves too hard and entering higher intensity zones unnecessarily.
Directly below the training zone bars, you'll find a comparison of the planned versus the actual number of recovery, aerobic, threshold and speed workouts for each swimmer.

Activity and RiskSummary
The activity and risk summary sections provide key metrics such as attendance, load and volume. Monitoring these metrics allows you to track workout consistency, and manage workload effectively to prevent overtraining or undertraining.

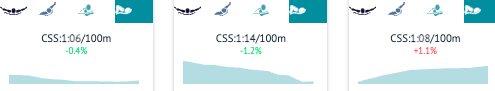
Critical Swim Speed & Skills Snapshot
Below the activity and risk summary, you'll find Critical swim speed changes over the last 90 days. This metric goes beyond speed improvements; it highlights if enough threshold work has been done in each stroke to improve the swimmer's critical swim speed. By selecting different stroke types, you can examine the changes in Critical Swim Speed as well as the most and least improved metrics for each stroke. The best and worst metric helps you pinpoint the athlete's strengths and areas that may require more attention.