Championship seasons aren’t decided in August. They’re decided across the 30 Sundays that come after.
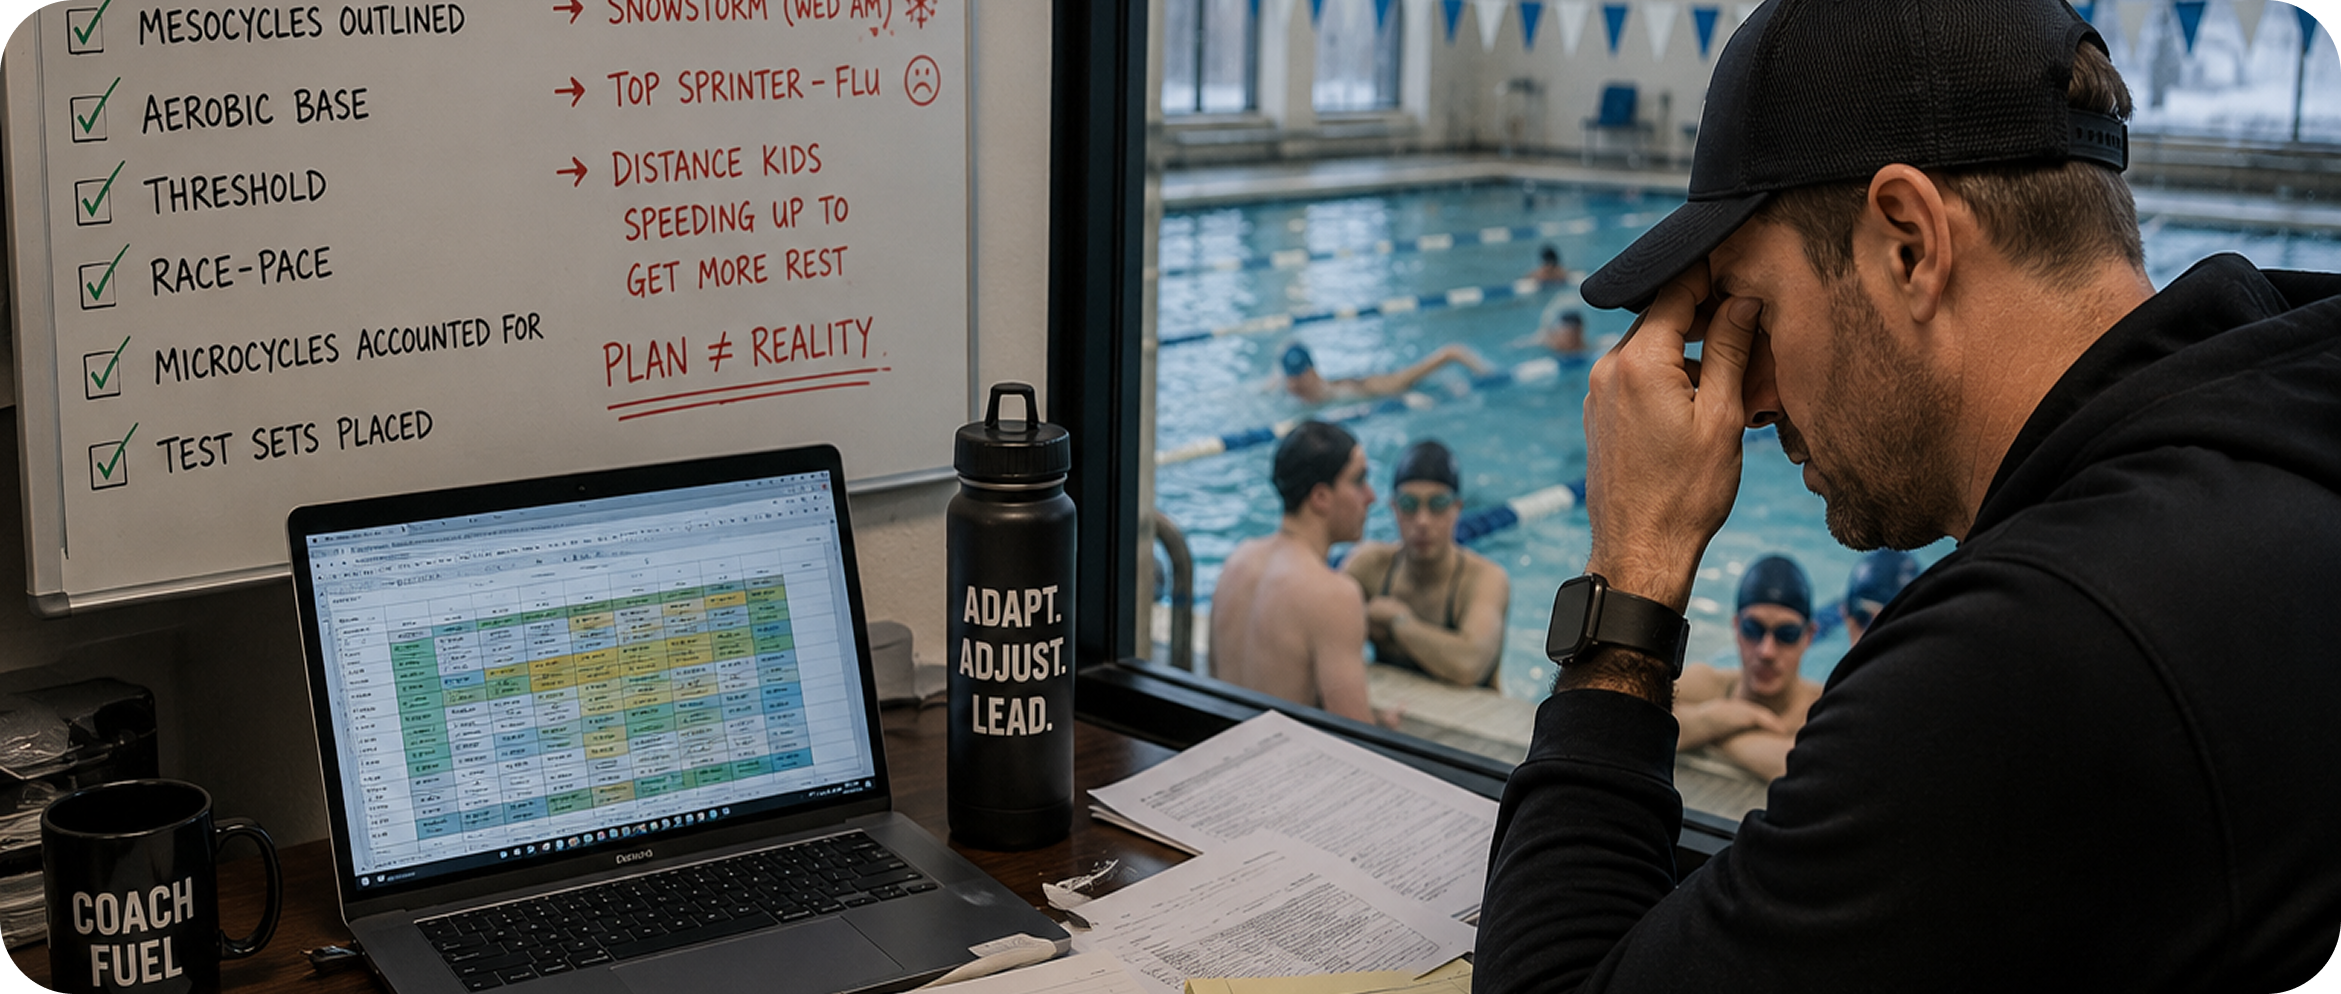
You spent August building a beautiful seasonal plan. You worked backward from your championship meet. You mapped your macrocycle, sketched your mesocycles, scheduled when you’d hit aerobic base versus threshold versus race-pace. Maybe you even did it in the Swimming Canada or USA Swimming template — every microcycle accounted for, every test set placed.
Then real life happened.
You talked too long during practice. A snowstorm cancelled Wednesday morning. Your top sprinter caught flu in week 11. Your distance kids hated the long aerobic sets and quietly accelerated their pacing to grab more rest. By week 14, the plan on paper barely resembled the work that actually got done in the water — and you knew it. But with 22 athletes, eight weeks until your taper meet, and a Tuesday morning practice to write, nobody had hours to spend reconciling the gap.
So the season drifted. Not catastrophically. Just enough.
This is the silent leak that decides championship seasons. It’s not the workouts you wrote. It’s the hundreds of small course corrections you didn’t make.
A head coach we work with put it this way during a recent review, halfway through his season:
“Going through these workouts, I’ve been like, wow, we’re getting all these yards in. And you look at it now, it’s like… half sometimes.”
He wasn’t a bad coach. He’s a very good one. He just couldn’t see the gap without the data in front of him.
The math of small adjustments
“If you had access to an advanced data collection system, and could see — every single week — whether your team was actually doing what you asked of them… how much would your season change?”
For more than a decade, the most successful coaches across endurance sport have been quietly building their advantage on a counterintuitive principle: small, frequent, consistent adjustments compound into outcomes that no single big decision can match.
Most people know the headline. In 2003, Sir Dave Brailsford took over British Cycling — a federation that had won a single Olympic gold in nearly a century — and applied what he called the aggregation of marginal gains. The idea was almost embarrassingly simple: if you improve every variable involved in cycling by just one percent, the cumulative effect is huge. He looked at every component. Tire pressure. Massage gel formulation. Pillow type for athletes traveling. Hand-washing technique to reduce illness during competition.
The result became sports folklore. British Cycling captured 70% of the available cycling gold medals at Beijing 2008. They repeated it at London 2012. Team Sky won the Tour de France in 2012 with Bradley Wiggins, kicking off six wins in seven years.
But here’s the part most people miss when they retell the story: it wasn’t the individual 1% gains that won championships. It was the cadence. Brailsford didn’t find every gain at once. He built a system that found, measured, and adjusted for marginal gains continuously — week after week, year after year. The math of the aggregation only works if you have the discipline of repeated, small, data-driven correction. It’s not just a clever quote — it’s an operating system.

The aggregation of marginal gains — 52 weeks of 1% weekly gains, compounding
The research backs this up across sport — and especially across the sports that look most like swimming.
What the cross-sport research actually shows
When researchers have tested individualized, data-guided training prescription against well-designed predefined plans, the data-guided approach has consistently produced more performance with fewer hard sessions.

Performance improvements: HRV-guided vs predefined training
In a foundational trial from Kiviniemi and colleagues (2007), 26 runners were randomized into either daily heart-rate-variability-guided training or a predefined four-week plan. The HRV-guided group improved both maximal running velocity and VO₂peak. The predefined group improved maximal running velocity — but didn’t move VO₂peak. The change in running velocity was significantly greater in the data-guided arm. The authors’ conclusion was direct: cardiorespiratory fitness can be improved more effectively by guiding daily training from current biological state than by following a fixed plan.

The same pattern shows up again and again. Vesterinen and colleagues found HRV-guided runners hit 3,000m performance improvements while completing fewer moderate- and high-intensity sessions than their predefined counterparts. Nuuttila and colleagues extended the idea to recreational runners with twice-weekly adjustments: individualized training increased the rate of high responders and decreased the rate of low responders. In adolescent endurance runners at altitude, Bahenský and Grosicki tracked an HRV-guided group that accumulated 32 training adjustments versus just 14 in the predefined controls — and produced VO₂max gains of 4.27% versus 1.26%. Every athlete in the data-guided group returned with a personal best. Three-quarters of the control group did.
In cycling, Javaloyes and colleagues found that daily HRV-guided training out-performed not just standard periodization but also block periodization — the more sophisticated, modern alternative.
Read those results together and the picture is clear. Across sports built on small race margins, dynamically adjusted training tends to win. It produces more performance, with fewer hard sessions, and more equitably across the team — fewer athletes left behind. This is what coaches really mean when they say train smarter, not harder.
The swimming evidence
Swimming-specific research tells the same story, with two important nuances: the best plans are progressive and undulating (not flat), and individual response is individual (not universal).
The single most comprehensive study of elite swim seasonal architecture is Hellard et al.’s 2019 analysis of 138 elite French swimmers across 20 competitive seasons. The team analyzed the 25 weeks preceding each swimmer’s season-best performance and found, across sprinters, three distinct training-load patterns.
The fastest sprint profile wasn’t a flat, predictable plan. It used two long macrocycles of 14–15 weeks. It had progressive load increases in the second half of the season. And it featured moderate week-to-week variability of about 6 ± 3% — undulating, not steady — with two specific load peaks at 10–11 weeks and 4–6 weeks before the major meet.

What the fastest swim seasons actually look like — Hellard 2019
The slowest profile was the opposite: a stable, flatter plan with low variability and decreasing load between macrocycles. In other words, the swimmers who got fastest didn’t follow a steady plan executed perfectly. They followed an intentionally varied plan executed with weekly precision.
Hellard’s separate study on the six weeks before a major meet went further. The overload-and-taper pattern associated with the greatest performance improvement wasn’t fixed. It was a training-load peak in week one of overload followed by a slow linear decay across the next two weeks — and then a first-week peak during taper followed by another slow decay. Most strikingly: the optimal pattern evolved across an athlete’s career. In the first three seasons, better results came from maintaining medium load from overload into taper. From the fourth season onward, the optimal pattern shifted to higher overload followed by a sharper taper reduction. Inside the same athlete’s career, the right weekly sequence changed.
Collette and colleagues monitored high-performance swimmers daily for 17 weeks and found exactly the kind of complexity a coach is up against. Athlete responses to load showed strong individual time lags ranging from zero to seven days. Response strength and direction varied athlete-to-athlete. The metric that best tracked recovery-stress state wasn’t ACWR — it was session-RPE, particularly when expressed relative to volume.
Translate this into coaching: a single template, however well-designed, cannot account for the fact that on Wednesday morning, Athlete A is responding to last Friday’s threshold set, while Athlete B is still processing Monday’s high-intensity day, while Athlete C — who slept poorly because of a high school exam — is responding to nothing at all. The only thing that can keep up with that complexity is a weekly feedback loop that closes the gap between the plan you wrote and the work your team actually did. It’s not just a nice-to-have — it’s the fastest path to improvement that the research has identified.
How small is “small enough to matter”?
This is the part where it gets visceral.
Across elite swimming, the race-to-race variation in performance for a single athlete (Paton & Hopkins) sits around 0.4%. The smallest worthwhile change — the smallest performance shift that meaningfully alters the probability of making a final or medaling — has been estimated as low as 0.2–0.4% of finishing time.
Think about that for a 200 freestyle. A 1:50.0 swim. A 0.4% improvement is 0.44 seconds. That’s the difference between sixth and a finals lane at Junior Nationals. Between scoring at NCAAs and watching from the stands. It’s the difference between a kid finishing high school as a borderline recruit and a kid stepping onto a college pool deck on a scholarship.
Pyne and colleagues analyzed 7,832 competition times from World Championships and Olympic Games and reported a blunt conclusion: only the swimmers who progressed from their prior season’s best into the major meet had a meaningful chance of medaling. Progression at the top end of the sport is measured in tenths of a percent.
We see this play out in real teams constantly. One head coach we work with described an athlete who’d been chasing a national qualifying cut for years and finally cracked it:
“She has never qualified for a national meet before. And so she is already on the B cut standards and heading towards the A cut. And a lot of it comes through what we’re seeing happening here — her transition of the walls.”
Turns. Not a new training program. Not a new diet. Not a different stroke. The walls. A single skill area, isolated by the data, attacked weekly for a season — and a kid who’d never made the meet is now chasing the A cut.
When the difference between a medal and fourth place is half a percent of finishing time, the cumulative effect of 100+ small course corrections across a season is not a marginal advantage. It is the season.
The silent leak: when “the plan” stops describing reality

Same yardage, same set on the whiteboard, wrong internal load
If there’s a single piece of evidence that should reshape how coaches think about their seasonal plans, it’s this: the median squad executes 15–20% less than the plan calls for. And often, the load they did execute was the wrong kind.
That number isn’t a hand-wave. It shows up in continuous monitoring data wherever it’s been measured. Coaches lose 15–20% of intended training time to instructional interruptions, prolonged technical explanations on deck, athletes modifying their own rest, and the inevitable absences of a real-life roster. It happens to every coach. It happens to head coaches with PhDs in exercise physiology. It is the gravitational pull of practice.
But the more dangerous version of the leak isn’t time lost. It’s intensity drift.
The most-observed pattern, almost universal in fit teams during the early base-building weeks of long-course season: athletes prescribed low-intensity aerobic work quietly accelerate the pace. Why? Because swimming a 75% aerobic set on a 1:30 send-off earns five seconds of rest. Swimming the same set at threshold pace earns thirty seconds of rest. Athletes are not lazy — they are rationally choosing the version of the workout that feels better. From the deck, the external load looks identical. The yardage on the whiteboard matches the plan. But the internal load — the metabolic cost, the lactate accumulation, the stress on glycogen — has migrated from aerobic into threshold. The coach prescribed base; the team did threshold.
This is the leak that compounds. The athlete doesn’t accumulate the aerobic base needed for later high-intensity work. They start to accumulate threshold fatigue that wasn’t part of the plan. Six weeks in, the coach can’t understand why race-pace work feels heavier than usual. Eight weeks in, the early-season swim times are flat. Ten weeks in, two athletes are mysteriously battling persistent shoulder soreness, three are flagged for poor sleep, and the head coach — staring at a championship meet that’s eight weeks away — is starting to wonder whether to taper deeper, lighter, longer, or shorter.
One head coach we work with caught the drift in his own program when he pulled up his Weekly Report on a TV with his athletes watching:
“This practice was supposed to be a threshold. And this particular swimmer was minus 10%. So that particular swimmer, for whatever reason, decided to swim that practice aerobically with, you know, horrible effort.”
That’s the leak surfaced. One athlete. One set. One ten-percent miss. Without the report, that swim looks identical to every other swim on the deck. With it, the coach has a decision to make for next week.
The plan didn’t fail. The feedback loop did. Or, more precisely: there wasn’t one.
The three levers, every week: Effort, Skills, Recovery
The good news: across the literature, the same three categories of weekly adjustment account for almost all the benefit. Get these right, and the small adjustments compound. They are Effort, Skills, and Recovery — the triad we’ve been building around at TritonWear since well before we had the tooling to support it properly.
We frame the work inside a simple repeatable cycle: Observe → Discover → Adjust. Observe what your team actually did. Discover the gap between intent and execution. Adjust next week to close it. Every Sunday. Three decisions. Most weeks, not even that.
1. Effort — closing the plan-vs-execution gap
This is the biggest leak and the easiest fix. Every week, the question is the same: did the team actually do the type of work you asked for? Not the total yardage. Not the number of practices. The distribution across training zones.
The specific adjustment is usually small. Imagine a weekly report comes back showing only 40% of your team hit the prescribed aerobic plan, and that most of the missed work drifted up into threshold. You’re not going to overhaul the next week — that would push the team into a different problem. Instead: pull one scheduled threshold session next week, and replace it with an aerobic session with strict pacing limits. That’s one decision. Twenty minutes of planning. And it fixes a leak that, if left to compound, would still be costing you yards by week 20.
The same pattern works in the other direction. If your team executed more aerobic than planned because a hard set fell apart, pull tomorrow’s recovery day and substitute it with the threshold work you skipped. Specific. Small. Targeted. The sweet spot is one substitution per week — enough to course-correct, not enough to break the rhythm of the plan.
2. Skills — keeping the goals that matter moving
Most teams set 20–30 skill goals at the start of a training block, spread across underwater, over-water, and transitions. The honest reality of week-to-week coaching is that not all of them progress. Some technical priorities stall. Others quietly fall off the radar entirely.
The weekly adjustment here is to ask, which goals didn’t move this week, and what’s the smallest intervention that gets them moving again? Maybe breath count isn’t budging on the team’s freestyle goals — not because anyone is regressing, but because nobody’s actually being pushed to think about it during sets. The fix: embed breath-control work into next week’s aerobic main sets. Pick the two long-pull sets that are already on the plan, and add a stroke-breathing pattern constraint. You haven’t changed the season plan. You’ve just made one decision about how one set gets executed.
This is where the Tradeoff Triangle — Volume × Speed × Skills — comes into focus. Skills aren’t a separate workout. They’re embedded inside the volume and speed work you’re already doing. The weekly review tells you which ones to embed next.

3. Recovery — protecting the athletes who are at risk this week
This is where compounding goes longest-tail. Overtraining doesn’t usually announce itself with a single bad session. It builds across two or three microcycles of slightly too much, slightly too soon, slightly out of sync with how each athlete is actually responding. By the time it shows up in race times, the damage is already done — and the recovery costs weeks, not days.
The Acute:Chronic Workload Ratio framework (popularized by Tim Gabbett, and the underlying math behind TritonWear’s Readiness score) gives a clean way to triage. The 7-day acute load versus the 28-day chronic load tells you whether each athlete is in a green, yellow, or red zone right now.
The weekly adjustment isn’t to put the whole team into recovery. It’s to identify the two or three athletes who are over the line this week — usually the ones who came back from an exam-week absence and went straight back to 10 practices, or the multi-sport athletes whose internal load is being driven up by their afternoon track workouts — and put them in a recovery lane for one or two sessions. Reduced volume. Strict Zone 1. The rest of the team keeps progressing as planned.
One adjustment. Two athletes. One session. Possibly the difference between those swimmers being healthy at champs and missing the meet entirely.
That’s the Recovery pillar working across a season. Nobody is amazed when a swimmer who’s been overtrained for six weeks turns in a flat swim at champs. They’re amazed when a swimmer who should have been overtrained — given everything that happened in their season — instead walks behind the blocks fresh, healthy, and lethal. That swim is the one that decides championships, and it lives mostly in what the coach didn’t have to do, because the data caught it before it caught the athlete.
What this looks like across a season

Small adjustments compound. Static plans plateau.
Now do the math. Across a 30-week macrocycle:
-
2–3 weekly Effort adjustments × 30 weeks = roughly 75 course corrections that keep your training distribution honest
-
A weekly Skills check × 30 weeks = 30 chances to keep stalled goals moving and prevent technical drift under fatigue
-
Recovery triage × 30 weeks = approximately 90–150 individual athlete-week decisions that keep your roster healthy
Most of those adjustments are tiny. None of them rewrites the season. Together, they protect the season you planned.
It’s not just more data — it’s a closed loop between the plan you set in August and the work that’s actually shaping your athletes today.
The literature on long-term athletic development reinforces just how powerful this compounding can be. In the global multi-generational dataset of elite swimmers analyzed by Post and colleagues, top swimmers progressively pull away from same-age peers from around age 12 onward — through repeated, longitudinal improvement, not through one breakthrough season. In an Italian longitudinal study of elite junior sprinters, only 10–26% of top-tier junior males and 23–33% of junior females successfully maintain their elite status into senior careers.
The largest single driver of that attrition is career-interrupting injury — much of it preventable with better weekly load management. The second-largest driver is dropout. Seventy percent of children leave organized sports by age 13. Most of them don’t leave because they hate swimming. They leave because the work stopped feeling connected to anything they could see.
That second number is the one most coaches under-weight. If the only feedback an age-grouper gets is “good practice” and a sense that they’re slower than the kid in lane four, the math of attrition takes over. If they can see their badges climb, their distance per stroke trend, their personal Triton Score moving — they stay. And kids who stay get to compound.
Why this is so hard to actually do
If the math is so favorable, why aren’t more coaches running this loop every week?
The honest answer — the one we hear constantly when we talk to head coaches — is that the analysis itself is the hardest part. We talked about this on a recent internal session with Dr. Megan Holtzman, our Chief Data Scientist. She walked through the Swimming Canada seasonal planning template, the more detailed USA Swimming version, and her own filled-out plan for the dragon-boat team she coaches. Her conclusion, halfway through:
“It’s not so bad to go back to the plan. The hard part is having the plan to start with… and then doing the math every week to see whether you’re hitting it.”
She’s right. The math is, frankly, rudimentary. It’s just arithmetic. Volume by zone, plan versus actual, athletes by acute-versus-chronic load, goals that moved versus goals that didn’t. None of it is conceptually hard.
But doing that math on Sunday night, by hand, across 22 athletes, against a six-month plan you wrote in August — every single week, for 30 weeks straight, on top of writing the next week’s workouts — is the part that breaks. We hear some version of this in nearly every coach conversation. One club head coach, halfway through a call, paused, looked at the average across his team that the platform was showing him, and said:
“I was counting all the 100s and dividing by 30. I didn’t see the average. Oh my God.”
That’s a serious head coach. The math wasn’t hard for him. The bandwidth to do it every week, by hand, was. Another coach told us recently — and this is the one we think about most when we design these tools:
“I just talk about it all the time, but there’s things that are just falling through the cracks because I just don’t have the time anymore… I’m just at a place where I’m not using data.”
That’s the coach this article is written for. Not the one who doesn’t believe in the math. The one who believes in it, wants to use it, and has been silently losing the marginal-gains battle because Sunday night isn’t long enough to do everything. It’s the reason most coaches we work with default to qualitative spot-checks at meets. It’s the reason even excellent coaches end up flying their seasons on gut feel by week 14. And it’s the reason the marginal-gains advantage that should be compounding for their team is, in practice, sitting on the table.
That’s the gap we’ve been working to close.
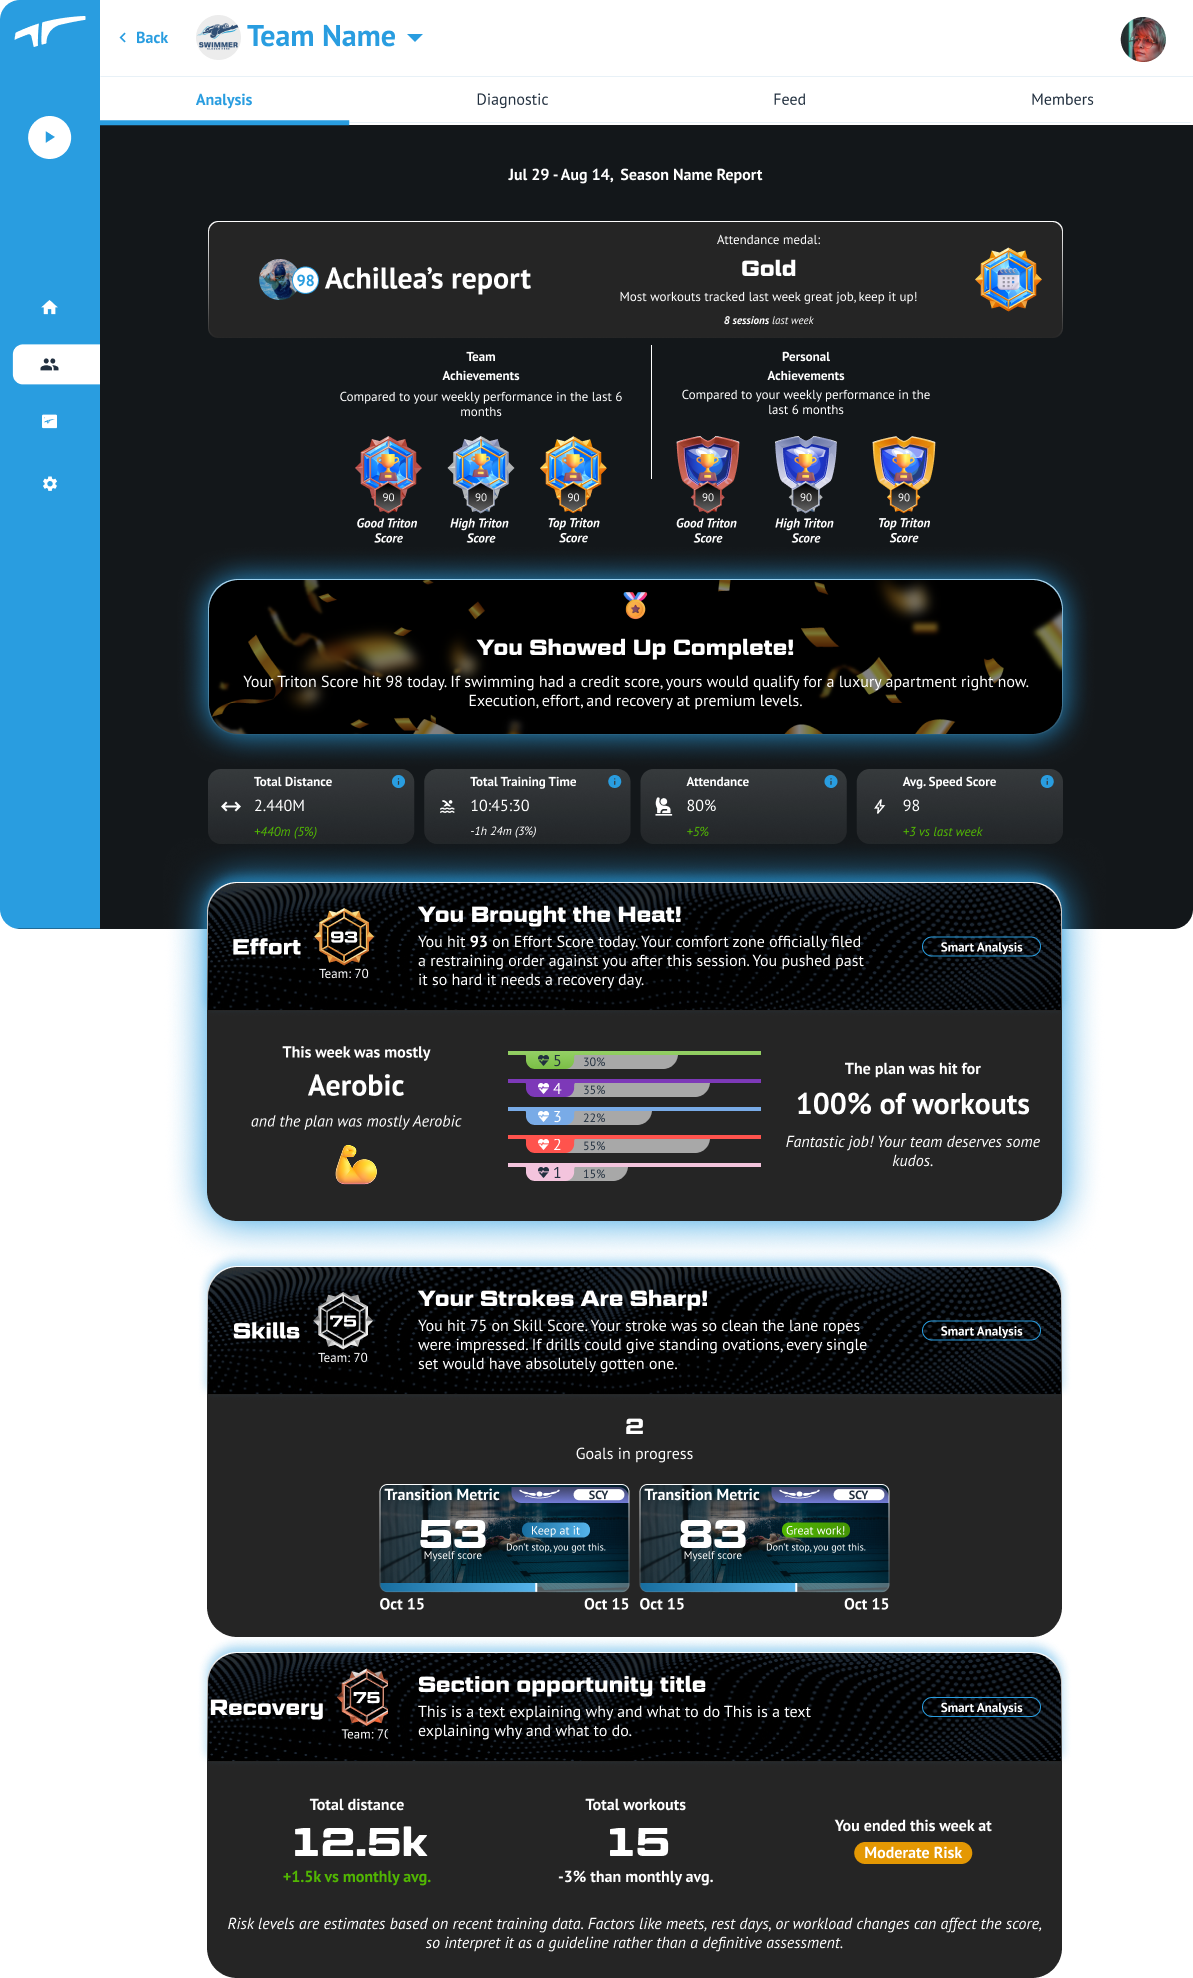
Introducing the new TritonWear Analysis Page
This is what we’ve spent the last year building. A unified Analysis Page that delivers the weekly feedback loop the literature has been pointing at for two decades — automatically, every Sunday, for every athlete on your team.
There are three things in it, each doing a different job.
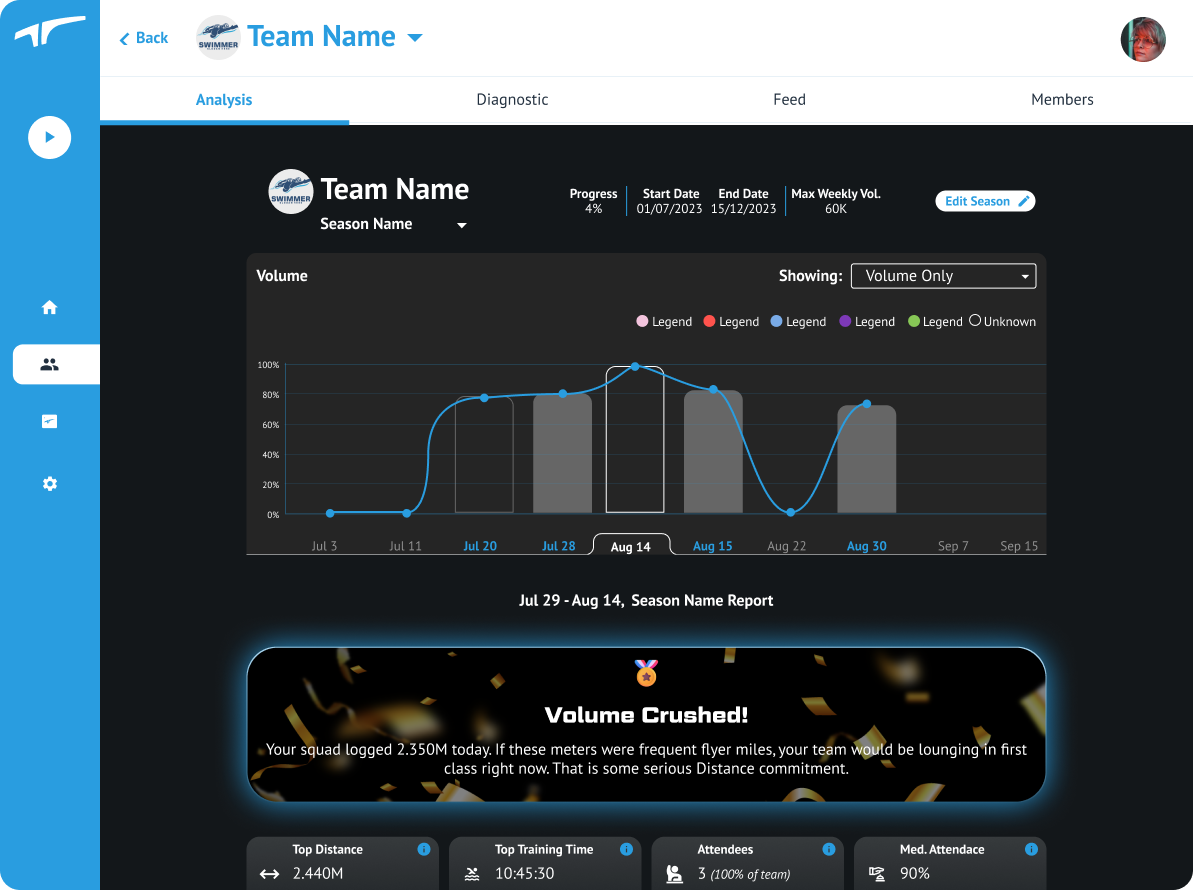
The Seasonal Tracker — your macro picture
The Seasonal Tracker is where your hypothesis lives. You start with the plan: a Swimming Canada-style or USA Swimming-style structure built around your big meets, with target volumes, target zones, and target distributions across the season. (We default to the right balance based on Long-Term Athlete Development guidance, but you can edit anything.) Then, every week, the tracker shows you what actually happened against that plan — your real attendance, real volume, real zone distribution, real time spent on each stroke and skill area.
This is the view that surfaces drift before it becomes catastrophic. If you’re 12 weeks into a 25-week season and you’re 4,000 meters under the planned aerobic volume across the median athlete, the Seasonal Tracker tells you that. Not by sending you a wall of numbers — by showing you a single picture of your season shape next to the one you intended.
The Weekly Reports — your micro decision

The Seasonal Tracker tells you where you’re trending. The Weekly Report tells you what to change this week to stay on course. They land in your inbox every Sunday — designed for the 15-minute review you’d want to do before writing Monday’s workouts.
Each report is built around the three pillars and the Observe → Discover → Adjust cycle that wraps them:
Effort. Did the team hit the planned zone distribution? You’ll see a clear breakdown — for instance, “40% of athletes hit the aerobic plan; the most-missed zone was aerobic, most drifted into threshold.” The report tells you, in plain language, the smallest next-week adjustment: swap one threshold session for an extra aerobic session. Or if the gap is bigger: swap two. You decide; the report scopes the decision. We’re working toward an even sharper version of this — one that tells you exactly how many aerobic minutes to substitute, against the specific microcycle plan you set in August.
Skills. Which team-level and individual goals moved, and which didn’t? For each stalled goal, the report points at where in next week’s plan to embed the work that will move it. Breath count flat? Add a stroke-breathing constraint to your two longest aerobic main sets. Push depth flat? Add an underwater-focus block on Tuesday and Friday. You’re not adding workouts. You’re enriching the ones you’re already going to do.
Recovery. The risk triage. Every athlete is bucketed into low, moderate, or high risk using the 7-day-vs-28-day load comparison. Low-risk athletes keep progressing. Moderate-risk athletes stay flat next week. High-risk athletes — the two or three on the roster who quietly tipped over the line this week — get a specific intervention: one or two recovery-lane sessions, reduced volume, Zone 1 only, and they’re back to safe before the next overload week.
Leaderboards and Stroke Mastery Badges — the athlete side of the loop
The third piece is for the swimmers. A leaderboard view that benchmarks each athlete against their teammates and against their own historical baseline — and a Stroke Mastery badge system that gives them a clear progression path on each stroke. Badges unlock as athletes hit technique-execution thresholds in each phase: underwater, over-water, transitions. They aren’t trophies. They’re milestones the athlete can see themselves moving toward.
What we hear from coaches the first time they show it to their team is the part that surprises them most. A club coach told us:
“My kids like hover around my iPad when I turn it on just to see if their name is number one.”
And the one that tells you the loop is closing in the right direction — when athletes start pulling reports from the coach instead of the other way around:
“They’re like, ‘Coach, why didn’t we get our report this month?’ I’m like, ‘Because I’m waiting for the quarter report.’”
The research on continuous feedback is unambiguous: athletes who can see and understand their data show higher motivation, better adherence, and stronger ownership of their development. Critically, in the longitudinal studies of why kids stay in swimming or leave it, the strongest predictors are visibility of progress and connection to a coach. The leaderboards and badges turn the same weekly data a coach reviews into something an 11-year-old wants to engage with — and that’s how the 70% who would have walked away at age 13 start to compound into the 10–26% who make the senior elite transition.
The leaderboards are also the piece that closes the loop on the parent conversations every club coach knows by heart. When a parent asks why their swimmer hasn’t moved up, the data is visible, the gaps are concrete, and the conversation shifts from opinion to evidence. As one head coach put it:
“This is just perfect because I can show them the data based on this, and so they can know… there’s data that supports that. And this is great for me because it’s not me saying ‘I’m crazy and I want you to do this.’”
The coach stops being the messenger and starts being the guide.
What week 1 to week 30 actually looks like

A coach’s 30-week feedback loop
Here’s the rhythm we’re proposing — and the one we’re already seeing the most engaged teams run.
Sunday evening, 15 minutes. The Weekly Report has landed. The Seasonal Tracker has updated. You scan three things:
-
Effort: Are we still on the seasonal shape? If the team drifted, one substitution in next week’s plan.
-
Skills: Did the goals we said matter most this block actually move? If a goal stalled, embed it into existing sets next week.
-
Recovery: Anyone in the red? If yes, one recovery-lane assignment for one or two sessions.
That’s it. Three decisions, most weeks. Sometimes only one. Occasionally none if the team executed cleanly.
You make the calls. You write the workouts. Monday morning, you walk on deck with a plan informed by what actually happened last week — not by what you guessed about it.
One head coach we work with described the cadence in exactly the terms we built it for:
“It personally helped me be able to take a quick look through at the end of each week. See where we are and get a much better hold on where we’re going, and whether we’re in the right spot or we got to tweak a little here or there.”
That’s the loop. Tweak a little here or there. Then again next week. Then again the week after that.
Now repeat that 30 times across a season. Then 30 more. Then 30 more.
By the end of one season, you’ve made on the order of 70–150 small course corrections you wouldn’t have made before. By the end of a four-year college career, that’s somewhere between 300 and 600 small, individualized adjustments to a single athlete’s training arc. Each adjustment, on its own, is invisible. The cumulative effect is the difference between an athlete who arrives at NCAAs healthy, sharp, and ready — and one who doesn’t.
That’s the math the research has been pointing at for 20 years. We’ve finally built the tooling to let you run it.
Back to the deck
It’s the Sunday before championships.
You open your laptop. The Weekly Report is sitting in your inbox. You scan it the way you’ve scanned it for 22 weeks straight. The team is sitting at the right shape on the Seasonal Tracker — aerobic-to-threshold split exactly where Hellard would have predicted for a sprint-heavy cohort entering taper. Three athletes flagged green-to-green for the fifth week running. Two on the edge of moderate. None red. The breath-count goal you adjusted in week 9 is finally trending — you can see the curve. Your distance kid who tipped into red in week 18 after exam absences has been sitting comfortably in green for nine weeks.
You write Monday’s workout in twenty minutes. You close the laptop.
Eight days later, your top sprinter steps behind the blocks for their A-final swim. Their warm-up looks crisp. Their stroke rate off the dive sits exactly where it’s supposed to. They split the first 50 a tick under their goal time. They hold their distance per stroke through the second 50. They turn fast. They finish.
The clock stops on a personal best.
Walking back from the deck, you don’t think about the spreadsheet. You don’t think about the Analysis Page. You don’t think about Brailsford. You think about the kid, who is now hugging their mom in the warm-down lane.
The difference between this swim and the one that left them in eighth at champs last year isn’t a thing you can point at. It’s not the plan you wrote in August. It’s not the workout you set Monday morning. It’s the 75 small adjustments that lived between those two moments — each one invisible from the outside, all of them adding up to a swimmer arriving healthier, sharper, and more confident than they would have otherwise.
That’s the math of small weekly adjustments. That’s the season. That’s the career.
The plan you write in August is your hypothesis. The data is the answer. The Analysis Page is the loop that makes the experiment honest — and the season compound.
Frequently asked questions
How long does it take to review a Weekly Report?
About fifteen minutes — the way it’s designed for Sunday-evening planning. The report surfaces the three or four highest-leverage decisions you need to make for next week’s microcycle. You’re not reading a wall of numbers; you’re reading a short list of “what changed, what to adjust.”
Does this replace the seasonal plan I built in August?
No — it protects it. The Seasonal Tracker treats your August plan as the hypothesis you’re testing. The Weekly Reports tell you when execution is drifting from the plan so you can make small course corrections to stay on track. The macrocycle structure stays. The weekly tactics adapt.
How is the Readiness score different from a fitness tracker’s “readiness” number?
TritonWear’s Readiness uses the swim-specific 7-day-vs-28-day load comparison — essentially the Acute:Chronic Workload Ratio framework popularized by Tim Gabbett and validated in elite-sport injury-prevention literature. It’s anchored in the actual training your swimmer did in the water, including session-RPE, not generic sleep or HRV proxies. A consumer wearable tells you if you slept well. Readiness tells you if you’re primed to swim well — and whether the next workout should push or pull back.
Can a coach use this without changing how they currently plan?
Yes. Coaches who plan a season top-down (the full Swimming Canada / USA Swimming template) get the most out of the Seasonal Tracker, because their plan becomes the comparison baseline. Coaches who plan more reactively still get the Weekly Reports — Effort/Skills/Recovery feedback works whether or not a formal macrocycle is in the system. Both modes are supported.
Does the AI Coach replace the coach’s decision-making?
The opposite. It scopes the decisions for you. The report doesn’t say “do X.” It says “your team drifted from aerobic into threshold; consider swapping a threshold session for an aerobic one next week.” You decide whether that fits the context your athletes are in. The AI surfaces the question; you answer it.
How quickly do coaches see results from this loop?
The plan-vs-execution gap usually surfaces in week 2 or 3, the first time the team’s executed zoning drifts noticeably from the plan. Skill-goal progress shows up over 3–4 weeks. Recovery triage saves an athlete from a high-risk week the first time it triggers. The compounding effect — the part where small adjustments add up — is what plays out across a full macrocycle and a multi-year career.
Want to see it on your roster?
If you want to see what the Analysis Page looks like running against your own team — your real swimmers, your real plan, your real season shape — we’d love to show you. In a 30-minute demo, we’ll walk through exactly what your team’s first Weekly Report would surface, which adjustments it would recommend for next week, and where the compounding curve takes you over the course of your next championship season. No slide deck. Just your data.
The plan is the hypothesis. The data is the answer. Let’s run the experiment.
Tristan Lehari is the CEO of TritonWear. He’s spent the last decade working with swim coaches at every level — from age-group clubs to NCAA programs to national-team federations — on what it takes to turn a season plan into a season result. The new Analysis Page is the latest step in TritonWear’s mission to bring elite sports science to every coach, every team, every Sunday night.